Configure Now
Items in Your Cart0
0Items in Your Cart
Start building your packageShop Now
The adoption of imaging technologies to create 2D and 3D models is becoming much more common in the management of critical infrastructure. In many cases of submerged infrastructure, remotely operated vehicles (ROVs) are the only way to easily capture reliable data for modeling.
Utilizing ROVs, operators are not required to obtain expensive or time-consuming certifications, and can immediately begin remotely surveying assets. This empowers nearly any member of a team to have the ability to inspect and scan structures in complex underwater environments, without any of the dangers associated with entering the water.

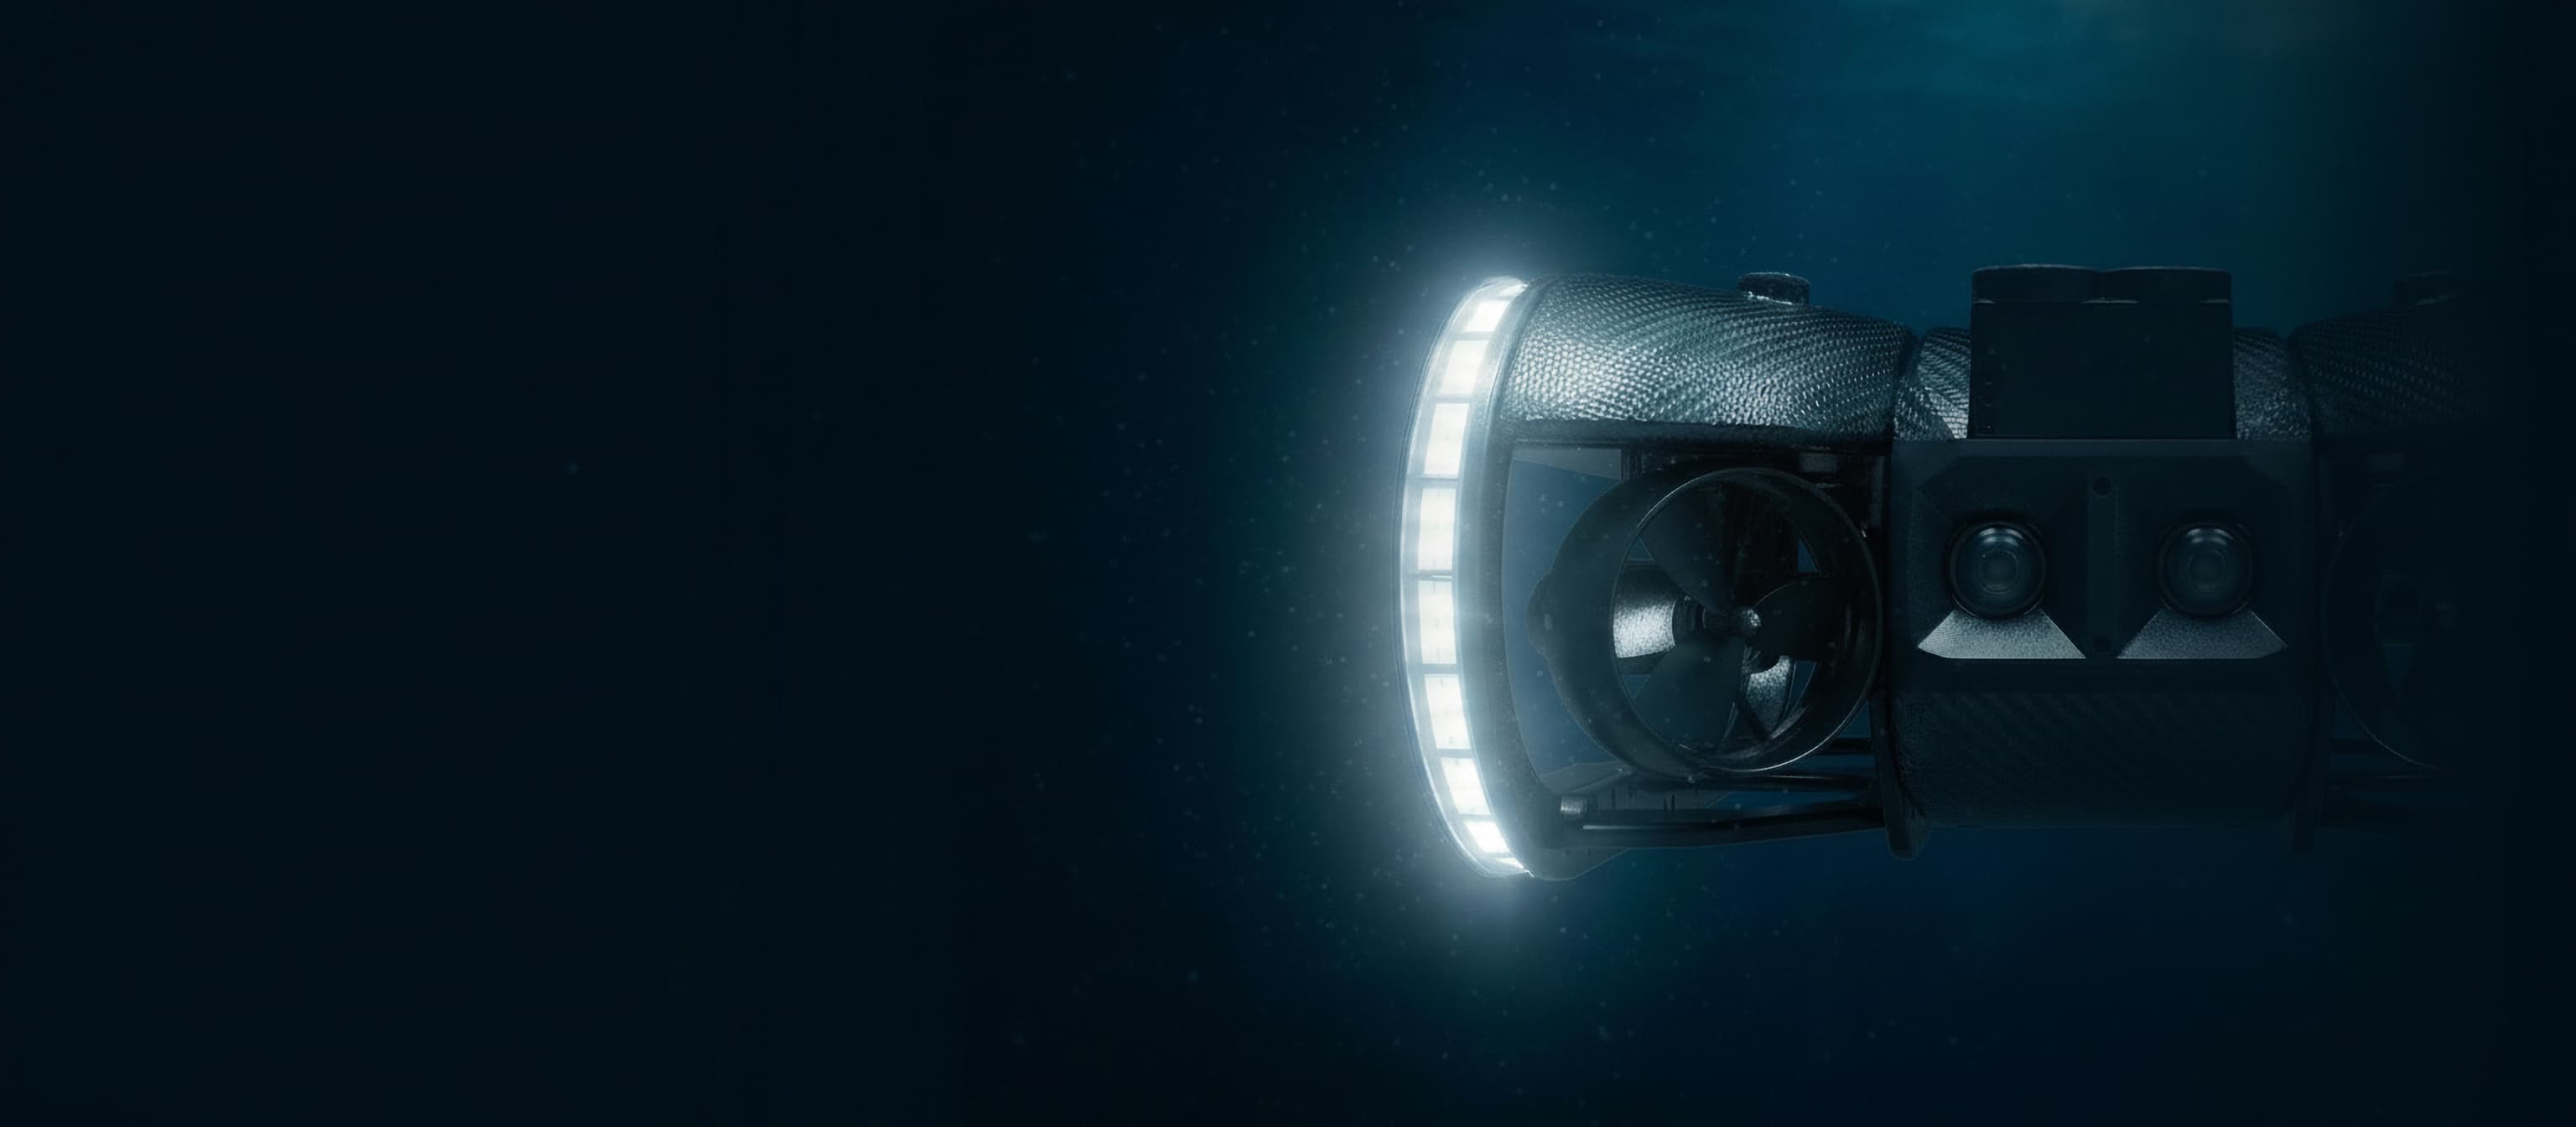
The use of different imaging sensors on ROVs, such as mono cameras, stereo cameras, sonar, and laser scanners allow operators to capture photogrammetry data to build detailed digital twins in both 2D or 3D, even in turbid water conditions. Using cloud-based software, operators and engineers can share, view, and compare their underwater missions in granular detail. This data can then be logged, tracked, and monitored over time. The resulting portfolio of information provides asset management teams with invaluable insights to help optimize asset management practices.
In addition to advanced scanning and image capturing capabilities, battery powered commercial-grade ROVs are extremely portable and allow for remote deployment in rural or difficult areas. This is especially helpful in situations like offshore energy platforms, where inspection equipment is commonly flown in by helicopter.
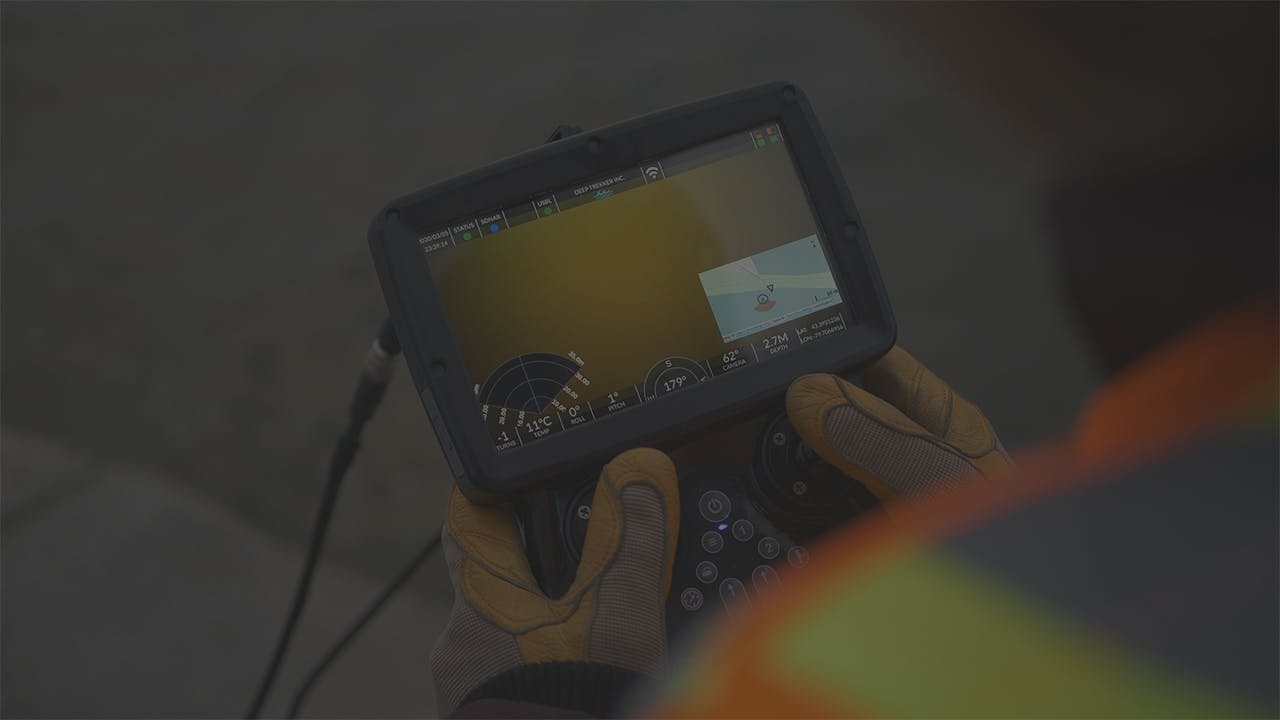
Working in conjunction with the collected visual data via camera or imaging sensors, ROVs equipped with Ultra Short Baseline (USBL) and Doppler Velocity Log (DVL) sensors can accurately pinpoint and display their location on a map. This adds an additional layer of data to surveying, allowing operators to not only generate detailed models but also understand and track the relative position and size of the asset being modeled.
These advanced positioning and stabilization systems have also been developed into methods of performing autonomous surveys without user input, such as Deep Trekker’s Mission Planner feature. This streamlines any repeated survey of a fixed structure since the route is pre-programmed and repeatable, with active yaw stabilization to combat unpredictable current patterns. Additionally, beginner pilots can use these functions to lessen any learning curve, as human interaction is reduced.

Underwater asset management refers to the monitoring, inspection, and maintenance of assets and infrastructure, such as oil pipelines, cables, bridges, and dams to ensure the efficient and safe operation of these structures while minimizing hazards. Regular management plays a critical role in ensuring the reliability, safety, and longevity of these assets located beneath the water's surface, supporting various industries such as oil and gas, renewable energy, marine transportation, aquaculture, and scientific research, to name a few.
ROVs have proven to be excellent resources for underwater asset management. Equipped with cameras, sensors, and manipulator arms, they are able to perform underwater tasks that are difficult or dangerous for a human diver to access.
They can be deployed to inspect conditions and capture details of underwater infrastructure, perform repair tasks, and collect data that can be further utilized for photogrammetry and 3D modeling, or making decisions that improve efficiency in maintenance schedules. Ultimately, regularly scheduled inspections with ROVs can help with identifying potential risks early and preventing costly damage.
Prioritizing the adoption of photogrammetry and laser scanning in the energy sector, for example, enables teams to create digital twins with these technologies. These virtual replicas empower engineering teams to proactively plan for component replacements long before any outages occur. By identifying critical paths and potential issues beforehand, the chances of unexpected complications during outages are significantly reduced, ensuring that regular plant operations can resume on schedule.
Underwater modeling provides a valuable tool for understanding, analyzing, and managing underwater assets. The process involves creating 3D or 2D digital representation of underwater structures, objects, or environments. Typically this is achieved through photogrammetry, which is the process of converting two dimensional photographs into texturally detailed, mathematically accurate 3D models by triangulating the visual information from multiple overlapping angles.
By utilizing a drone-mounted camera, or imaging sonar, it’s possible to capture ultra high-resolution photos and videos in hazardous or confined environments, as well as in murky waters, or at depths that would otherwise necessitate specially trained divers or pose significant risks. These images can then be transformed into textured 3D models using dedicated software like Pix4D, the industry gold standard, which has a free trial available to try out.
This specialized technique is valuable in ocean science, archeology, and research, as well as being utilized for surveying and mapping of underwater terrain and creating virtual models of pipelines or offshore platforms for monitoring purposes.
Both 2D and 3D underwater modeling techniques have their own advantages and applications. The choice between them depends on the specific goals of the project, the level of detail required, and the available resources.
Submerged 2D Modeling:
2D models have been widely used for various applications for centuries and remain essential in fields like urban planning, product design, construction, asset monitoring, and more. These models divide the underwater environment into a grid or mesh of cells or elements in the horizontal plane, providing information about properties like water velocity, depth, sediment concentration, or other variables.
Submerged 2D modeling is a simpler and cost-effective method for providing relevant information, especially when depth representation is unnecessary. Common applications include basic site layouts for maintenance or construction planning, architectural blueprints, and product design documentation.
Submerged 3D Modeling:
For projects where understanding all three dimensions is critical, operators may choose 3D modeling. This process is more complex, as it requires gathering and compiling more relative data to add depth, resulting in a highly accurate representation of objects or structures..
3D modeling demands more computational resources and expertise compared to 2D modeling due to its increased complexity and data requirements. However, it offers a realistic depiction of the underwater environment.
Typical applications of underwater 3D models include benthic sea floor mapping, dam/bridge/tunnel inspections, surveying canals and channels, and assessing offshore energy structures such as oil rigs, FPSOs, or pipelines.
By utilizing underwater modeling techniques, asset management teams can gain profound insights into underwater structures, enabling better decision-making and efficient maintenance practices.

Underwater modeling plays a critical role in understanding and managing underwater environments, supporting various applications in engineering, environmental assessment, marine science, and resource management. However, there are several challenges due to the unique characteristics and complexities of these environments.
These challenges can include:
Underwater visibility can often be poor, making it difficult to observe and measure underwater assets directly. This lack of visibility makes it challenging to collect data, validate models, and visualize the simulated results. Turbidity, suspended particles, and low light conditions can make it difficult to capture clear, high quality data and images, which affects the accuracy of measurements collected.
Topography can also pose a challenge, since underwater structures can have complex shapes and require advanced techniques and data acquisition methods that can capture the geometry with precision and accuracy.
Challenges with data acquisition can be due to limited operating time, equipment limitations, and complexity of structures. These factors can pose constraints on data collection, resulting in inaccuracies and insufficient data.
Because large quantities of data need to be analyzed and processed, data analysis can be a challenge, since it is time consuming and requires advanced algorithms to convert the collected data into an accurate model.
Additionally, working in harsh environments can pose a variety of challenges such as high currents and cold temperatures that can affect the ability to collect sufficient data, as well as compromising the safety of human divers that are deployed underwater.

ROVs are a valuable tool for data collection, observation, and monitoring in underwater environments, significantly improving the accuracy and reliability of underwater modeling processes. They enhance the quality and quantity of data available for modeling, facilitating better understanding, analysis, and management of underwater environments and structures.
Accessibility and safety are some of the main key benefits of using ROVs for underwater modeling. They enable data collection in areas that may be difficult or unsafe for human divers, and can operate at significant depths, withstand high pressures, and navigate through complex underwater structures. Battery powered capabilities also make ROVs highly portable, allowing them to be deployed in remote areas or confined spaces that might not be possible to reach with dive teams.
By using ROVs, operators can access and gather data from these challenging underwater environments, reducing risks to human divers and expanding the scope of data collection for modeling purposes. Also, operators do not require expensive certifications and immediate surveying can begin since ROVs can be deployed in minutes with very little set up or preparation work needed.
ROVs are not just limited to underwater inspections, however. Robotic crawlers are often superior to aerial drones for surface inspections because they can operate in confined, tight spaces, and harsh conditions - and are unlikely to become the subject of a foreign material report.
ROVs offer time-efficient data collection by systematically covering large areas and collecting data in a shorter time compared to traditional inspection methods. This efficiency allows for more frequent and comprehensive data collection, empowering operators to make informed decisions promptly. The Deep Trekker Mission Planner, with its autonomous path planning capabilities, further streamlines the process, enabling the ROV to follow specific waypoints and automatically conduct inspections..
Equipped with enhanced 4K cameras, Deep Trekker ROVs capture detailed visual information about the underwater environment, providing valuable insights into seabed characteristics, marine life, structures, and other features. This high-quality visual data supports photogrammetry and facilitates the development of accurate and realistic 3D models.
ROVs can also be integrated with imaging sensors, which allows the capturing of data for structural modeling even in low-visibility, turbid conditions. Advancement in design and integration with modular add-ons such as DVL station holding sensors that fight current and maintain altitude allow for consistent, clear imaging in the toughest environments. USBL positioning systems can accurately display the ROV location on the map, and allow operators to understand the relative size and position of the asset.
Cloud-based software integrated with ROVs allows for sharing and viewing of missions in a comprehensive manner. Data can be logged, tracked, and monitored in real-time to provide insight regarding asset management. Depth measurements are synchronized with each video frame automatically with log data. After collecting and aligning images, a 3D model can be easily created, wich makes it possible to obtain a thorough survey of all visible parts of a site, or object of interest.
Cloud-based software integrated with ROVs facilitates seamless sharing and viewing of underwater missions. Real-time data logging and tracking provide valuable insights for asset management. Depth measurements are automatically synchronized with each video frame, enabling the creation of detailed 3D models that offer a comprehensive survey of all visible parts of the site or object of interest

Automation in ROV operation is becoming an important part of the conversation as underwater technologies advance. Developments in self-driving cars, aerial drones, and AUVs have sparked the question: where do ROVs stand?
The main concerns when addressing underwater vehicle automation is positional awareness below the water surface. The radio frequencies used by GPS cannot penetrate water, rendering them unusable for ROV positioning. Low clarity, lighting conditions, and moving particles in the water also pose a challenge when trying to capture high quality images and triangulate positional data. As an alternative, ROVs can rely on an Ultra Short Baseline system (USBL) for positioning alongside a Doppler Velocity Log (DVL) for stabilization to achieve positional awareness.
ROVs fuse data from various essential underwater GPS technologies to create a best estimate of current position on a live map to aid navigation.
Deep Trekker is actively embracing the advancements in autonomy, 3D visualization, machine learning, and artificial intelligence. We prioritize close collaboration with various technologies to provide our customers with the most beneficial configurations. To achieve this, we are engaged in testing and integrating multiple technology types to simplify inspections for our users.
Notably, Deep Trekker has undertaken significant projects through the Canada Ocean Supercluster Grant. As a result, we have been awarded two innovation projects, receiving a substantial grant of $6,000,000.
The first project, known as Project Sentry, focuses on the development of a Resident Autonomous Aquaculture Cage Inspection system. This initiative aims to revolutionize aquaculture cage inspections by leveraging autonomous capabilities.
The second project, named Project AROWIND, involves the creation of an Autonomous, Unmanned Vessel with a submersible vehicle flyout. This system is designed to conduct inspections and construct models of offshore wind structures. Both projects represent our commitment to advancing artificial intelligence and autonomy in sustainable industries.
Through our engagement with the Canada Ocean Supercluster Grant, Deep Trekker aims to push the boundaries of technology and establish ourselves as leaders in the field. These endeavors will propel us to the forefront of artificial intelligence and autonomy, enabling us to provide cutting-edge solutions for sustainable industries.
Project Sentry3
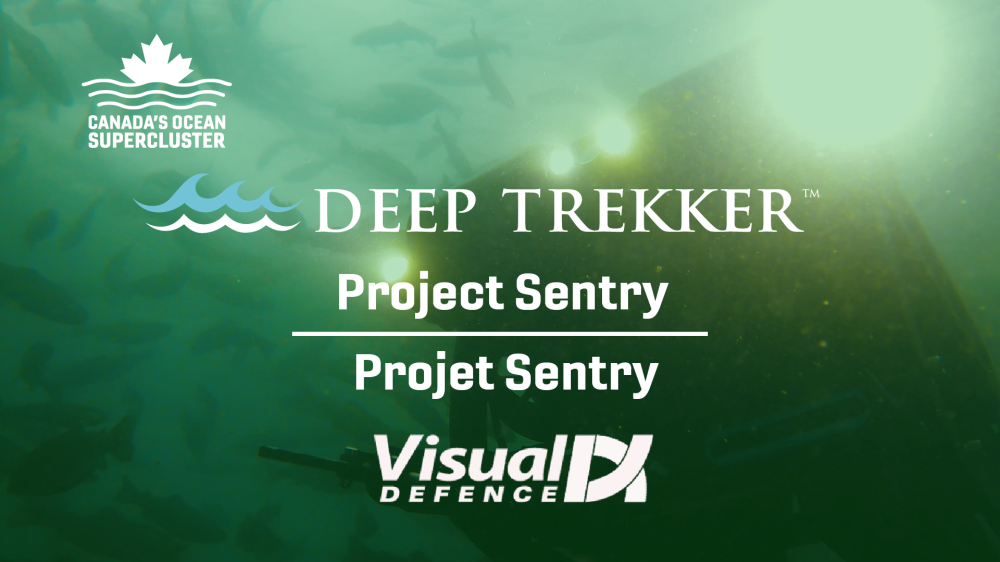
Project Sentry3 aims to revolutionize fish cage inspections through the integration of visual sensors, artificial intelligence programming, and SBL (Short Baseline) positioning. This innovative system will enable remote and autonomous inspections of fish cages. A remotely operated vehicle will be stationed in a dedicated garage, ready to be deployed for inspections and maintenance tasks. The primary objectives of this system are to minimize the risks of cage collapse, fish escapes, and ensure optimal fish health on fish farms.
In collaboration with Visual Defence and other partners, Deep Trekker's inspection system will leverage artificial intelligence and machine learning technologies to alleviate the burden on human operators. These advanced technologies will assist in identifying defects and irregularities, reducing the manual effort required for inspection processes.
While the initial focus of these projects is on the aquaculture industry, the technology being developed, including visual guidance, pattern recognition, and autonomy, holds potential for various other underwater applications beyond fish cage inspections. The advancements made in this project have the potential to benefit a wide range of industries requiring underwater inspections and maintenance.
Project AROWIND4
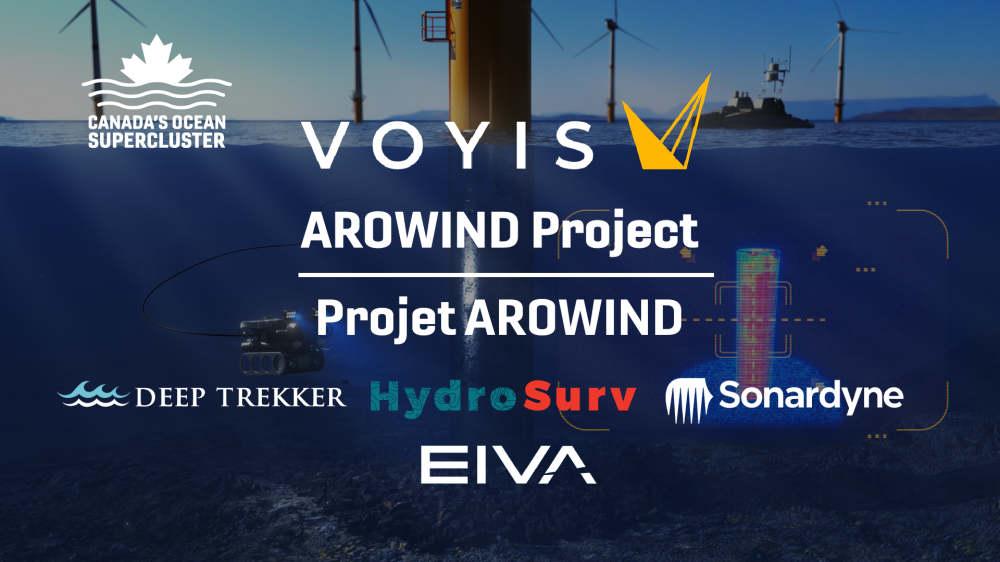
Project AROWIND4 merges visual sensors, acoustic positioning, and integration with a surface vessel to generate 3D models of offshore wind pilings and submerged structures. While initially targeting wind installations, the technological advancements in 3D modeling and system integration have broader applications.
The concept of "systems of systems" is central to this project, where various robotics technologies collaborate to achieve specific tasks. In this scenario, an unmanned surface vessel deploys an ROV, but combinations of unmanned ground vehicles, aerial drones, and autonomous underwater vehicles can be employed for different surveillance and inspection objectives.
The key to developing these systems lies in establishing software and firmware compatibility among the different components. Mechanical integration, on the other hand, varies depending on the specific task, but becomes more feasible once the capabilities of individual components are well-established.
By embracing this approach and building compatibility among technologies, families of systems can be formed, enabling seamless collaboration and efficient accomplishment of tasks. This opens up opportunities for diverse applications in surveillance, inspection, and beyond, driven by the advancements in software, firmware, and mechanical integration.
In Summary
The development of unmanned vehicles relies on the interconnected progress of autonomy, 3D visualization, and machine vision. Underwater autonomy is achieved through a range of sensors, including acoustic-based positioning technologies like USBLs, DVLs, and SBLs, as well as IMUs, proximity sensors, GPS logs from surfacing, and visual sensors. Visual sensors, such as stereo cameras, play a significant role in autonomous navigation and photogrammetry.
Accurate understanding of the vehicle's position is critical for autonomous navigation and 3D modeling. Positioning data guides the stitching of the model's components, and machine learning algorithms can aid in matching pixels or similar images together, enhancing the modeling process. It's important to note that there is no universal solution for every underwater challenge. Deep Trekker is dedicated to remaining at the forefront of the field by leveraging a variety of technologies. We integrate visual sensors, positioning systems, and software capabilities to simplify inspections.
While not all our ongoing projects can be publicly disclosed, we are more than willing to discuss your specific requirements. If you have particular integration needs or projects in mind, please reach out to us, and we will be happy to assist you.

March 17th, 2026
Two-day AIMS training program teaches SAR teams how to integrate sonar...
March 11th, 2026
Deep Trekker’s SPECTRA ROV integrates 3D Sonar SLAM, 4K stereo vision,...
November 3rd, 2025
At REPMUS 2025, Deep Trekker’s ROVs validated real-world mine countermeasure capabilities...